A subscription to JoVE is required to view this content. Sign in or start your free trial.
Near-Infrared Spectroscopy During Reactive Hyperemia for the Assessment of Lower Limb Vascular Function
In This Article
Summary
Here, we describe a non-invasive approach using near-infrared spectroscopy to assess reactive hyperemia in the lower limb. This protocol provides a standardized assessment of vascular and microvascular responsiveness that may be used to determine the presence of vascular dysfunction as well as the efficacy of therapeutic interventions.
Abstract
Vascular diseases of the lower limb contribute substantially to the global burden of cardiovascular disease and comorbidities such as diabetes. Importantly, microvascular dysfunction can occur prior to, or alongside, macrovascular pathology, and both potentially contribute to patient symptoms and disease burden. Here, we describe a non-invasive approach using near-infrared spectroscopy (NIRS) during reactive hyperemia, which provides a standardized assessment of lower limb vascular (dys)function and a potential method to evaluate the efficacy of therapeutic interventions. Unlike alternative methods, such as contrast-enhanced ultrasound, this approach does not require venous access or sophisticated image analysis, and it is inexpensive and less operator-dependent. This description of the NIRS method includes representative results and standard terminology alongside the discussion of measurement considerations, limitations, and alternative methods. Future application of this work will improve standardization of vascular research design, data collection procedures, and harmonized reporting, thereby enhancing translational research outcomes in the areas of lower limb vascular (dys)function, disease, and treatment.
Introduction
Cardiovascular disease (CVD) is the leading contributor to global mortality1. While myocardial infarction and stroke are the most common manifestations of CVD, vascular diseases of the lower limbs, such as peripheral arterial disease (PAD) and diabetic foot disease, contribute substantially to the personal, social, and healthcare burden of CVD2,3,4. Importantly, these disease states are characterized by microvascular and macrovascular dysfunction5 that contribute to symptoms (e.g., intermittent claudication), functional impairment, poor mobility as well as social isolation and reduced quality of life6. Historically, upper-limb vascular assessment techniques have been used as a measure of systemic vascular function and associated cardiovascular risk; however, these methods are potentially not sensitive to local impairments in lower limb vascular function7,8. While there is currently a range of techniques used to assess vascular function in the lower limb, such as flow-mediated dilatation (FMD) and contrast-enhanced ultrasound, each method has disadvantages and limitations, such as equipment cost, operator skill, or the need for invasive venous access. For these reasons, there is a need for standardized and effective techniques to evaluate lower limb vascular (dys)function that can be more readily implemented in research and clinical settings.
Continuous wave near-infrared spectroscopy (CW-NIRS) is a non-invasive, low-cost, and portable method that quantifies the relative changes in hemoglobin oxygenation in vivo. As the NIRS oxygenated and deoxygenated hemoglobin signals are derived from the small (<1 mm in diameter) vessels, local skeletal muscle metabolism and microvascular function are able to be evaluated9. Specifically, the tissue saturation index (TSI) [TSI = oxygenated hemoglobin/ (oxygenated hemoglobin + deoxygenated hemoglobin) x 100], provides a quantitative measure of tissue oxygenation9. When measured before, during, and after occlusion and reactive hyperemia, the changes in TSI indicate 'end-organ' vascular responsiveness, relative to the pre-occlusion baseline. Importantly, this method is sensitive to alterations in muscle microvascular responsiveness and perfusion associated with ageing10, disease progression11, and clinical interventions (e.g., revascularization surgery12,13 or exercise rehabilitation14,15,16,17) in individuals with, or at risk of microvascular dysfunction.
The availability of NIRS systems has led to a rapid rise in the number of research studies reporting microvascular function18. However, differences in reactive hyperemia testing protocols, omission of detailed, repeatable NIRS methods, as well as a lack of uniformity in the description, presentation, and analysis of NIRS response parameters make comparisons across individual trials challenging. This limits the collation of data for meta-analysis and the formulation of clinical assessment recommendations9,15.
Therefore, in this article, we describe our laboratory's standardized NIRS and vascular occlusion testing protocols for the assessment of lower limb reactive hyperemia. By disseminating these methods, we aim to contribute to the improved standardization and repeatability of data collection procedures and harmonized reporting.
Protocol
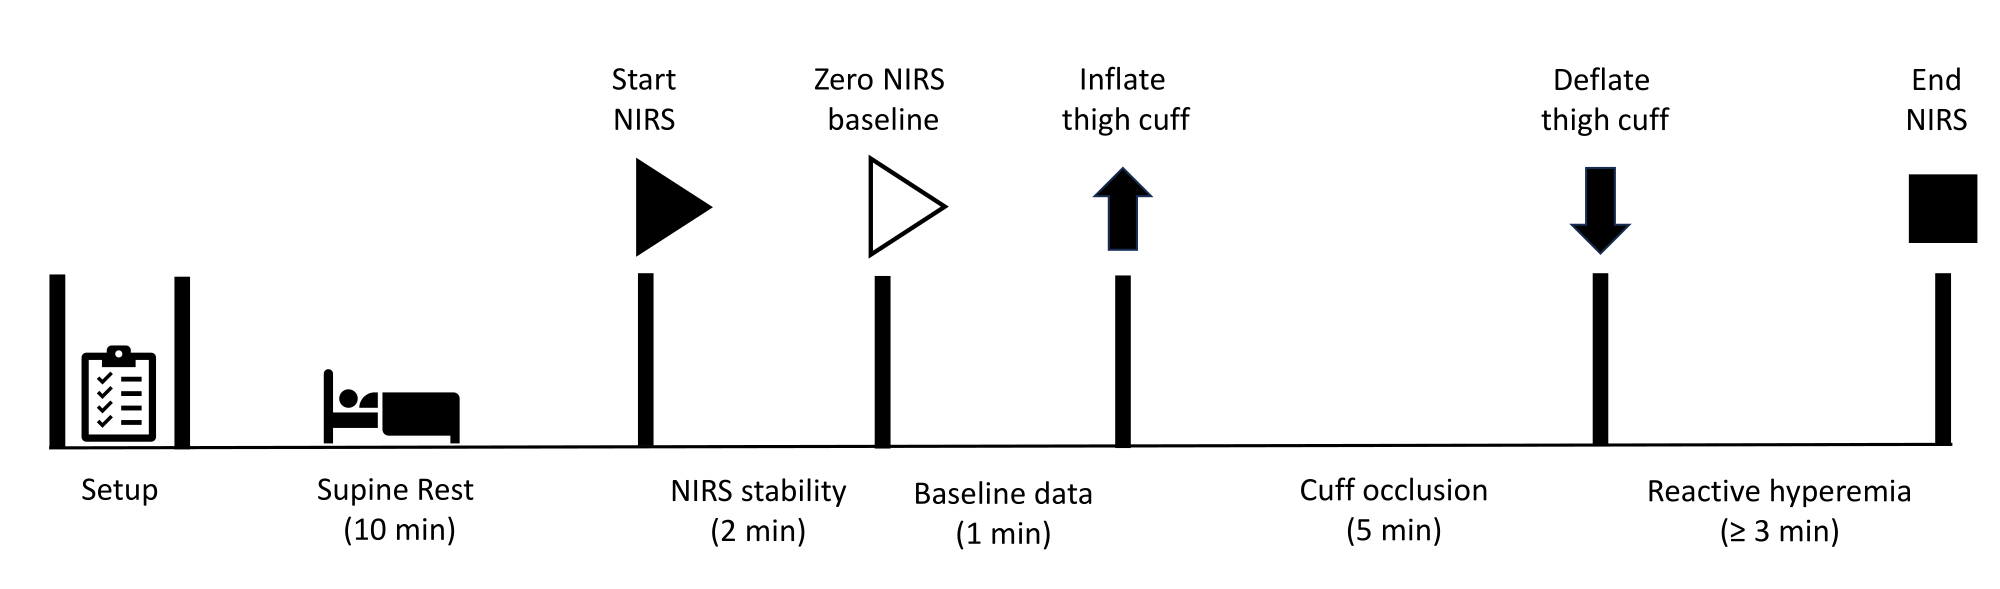
All methods described here have been approved by the human research ethics committee of the University of the Sunshine Coast. Furthermore, all participants gave their written informed consent to participate in the measurements outlined in this protocol. Please note, vascular occlusion testing in the lower limb is contra-indicated in individuals who have previously had a revascularization procedure involving a vascular graft or stenting of the femoral or popliteal arteries. After preparing the equipment, the participant is instructed to rest in a supine position for 10 min. At this point, NIRS data collection commences, with an initial 2 min period, allowing for stability of NIRS signals to be achieved. Baseline data are then collected for 1 min, at which point a cuff located at the thigh is promptly inflated to achieve arterial occlusion. Occlusion is maintained for 5 min before the cuff is rapidly deflated. Data collection continues throughout the reactive hyperemia period until signals have recovered to baseline. Figure 1 depicts an overview of the reactive hyperemia protocol, and the detailed steps are provided below. The equipment used for the study are listed in the Table of Materials.

Figure 1: Schematic outlining NIRS reactive hyperemia measurement protocol and timings. NIRS: near-infrared spectroscopy. Please click here to view a larger version of this figure.
1. Equipment preparation
NOTE: Various NIRS, cuff inflation/occlusion, and data collection systems can be used to obtain the representative results outlined below. It is important that investigators consult their own specific user manuals and are aware of unique software, calibration, ambient light, and participant/cohort-specific considerations.
- Ensure that all measurements are performed in a quiet, temperature-controlled room (21-23 °C).
- Confirm that all equipment and materials (see Table of Materials) are available.
- Ensure that the CW-NIRS device, and the computer that the device is transmitting to, are fully charged and powered on.
- Check that the NIRS device is paired with the computer displaying the NIRS data via Bluetooth and that measurement parameters of the NIRS unit are defined according to the experimental site and study design (an example: define the differential pathlength factor (DPF) of the near-infrared light).
NOTE: Most of the NIRS protocol steps and system settings are based on a combination of manufacturer's recommendations, researchers' experience, and expert/consensus opinion. Be aware that the values generated during measurement depend on the particular device and probes used as well as the settings chosen in the device software. There is also potential for a high degree of inter-individual variability in the signals collected. Furthermore, to allow for improved comparison between studies, it is important to report NIRS instrumentation particulars (e.g., include probe design, source-detector separation distances and wavelengths used), system settings, probe position/orientation in relation to muscle geometry and the analysis parameters/data treatment when publishing results from these measurements. - Enter the participant's data according to NIRS device software particulars.
- Connect the rapid cuff inflator to the air and power sources.
2. Participant preparation
- Ensure that the participant has read the participant information statement and consent form and has given their consent to participate in the measurement prior to commencement.
- Explain to the participant what to expect during the measurement while they remove their shoes and socks and stand stationary for relevant anthropometric measurements.
- Take a skinfold measurement (in triplicate) over the planned NIRS measurement site (e.g., on the medial aspect at the point of maximal calf circumference).
NOTE: This allows for the depth of skin and adipose tissue (routinely referred to as adipose tissue thickness - ATT) to be confirmed in relation to NIRS signal penetration depth. Alternatively, ultrasound can be used to determine adipose tissue thickness. Always keep in mind that the depth of the NIRS signal/measurement is approximately half of the receiver-transmitter distance9. - To maximize signal quality, check the planned site of the NIRS transmitter/receiver probe for any hair that may absorb light and remove hair by shaving if necessary.
NOTE: If the skin is compromised, for example, from cellulitis, or if edema is present, consider the appropriateness of measurement, as these issues relate to potentially reduced signal quality, signal penetration depth/tissue from which measurement is taken, as well as participant wound sterility. - Take measurements of and/or mark the position of planned NIRS probe placement in relation to relevant anatomical landmarks (e.g., superior surface of the medial condyle) to allow for accurate placement of the NIRS probe between and within participants (dependent on study design and probe design/shape) as oxygenation responses can display large heterogeneity between different muscles or even within regions of the same muscle.
- Ask the participant to lie in a supine position on an examination plinth or bed. The participant then rests for 10 min.
- Place a cuff around the thigh, proximal to the knee, ensuring that the tubes do not come into contact with the calf or the NIRS device (Figure 2).
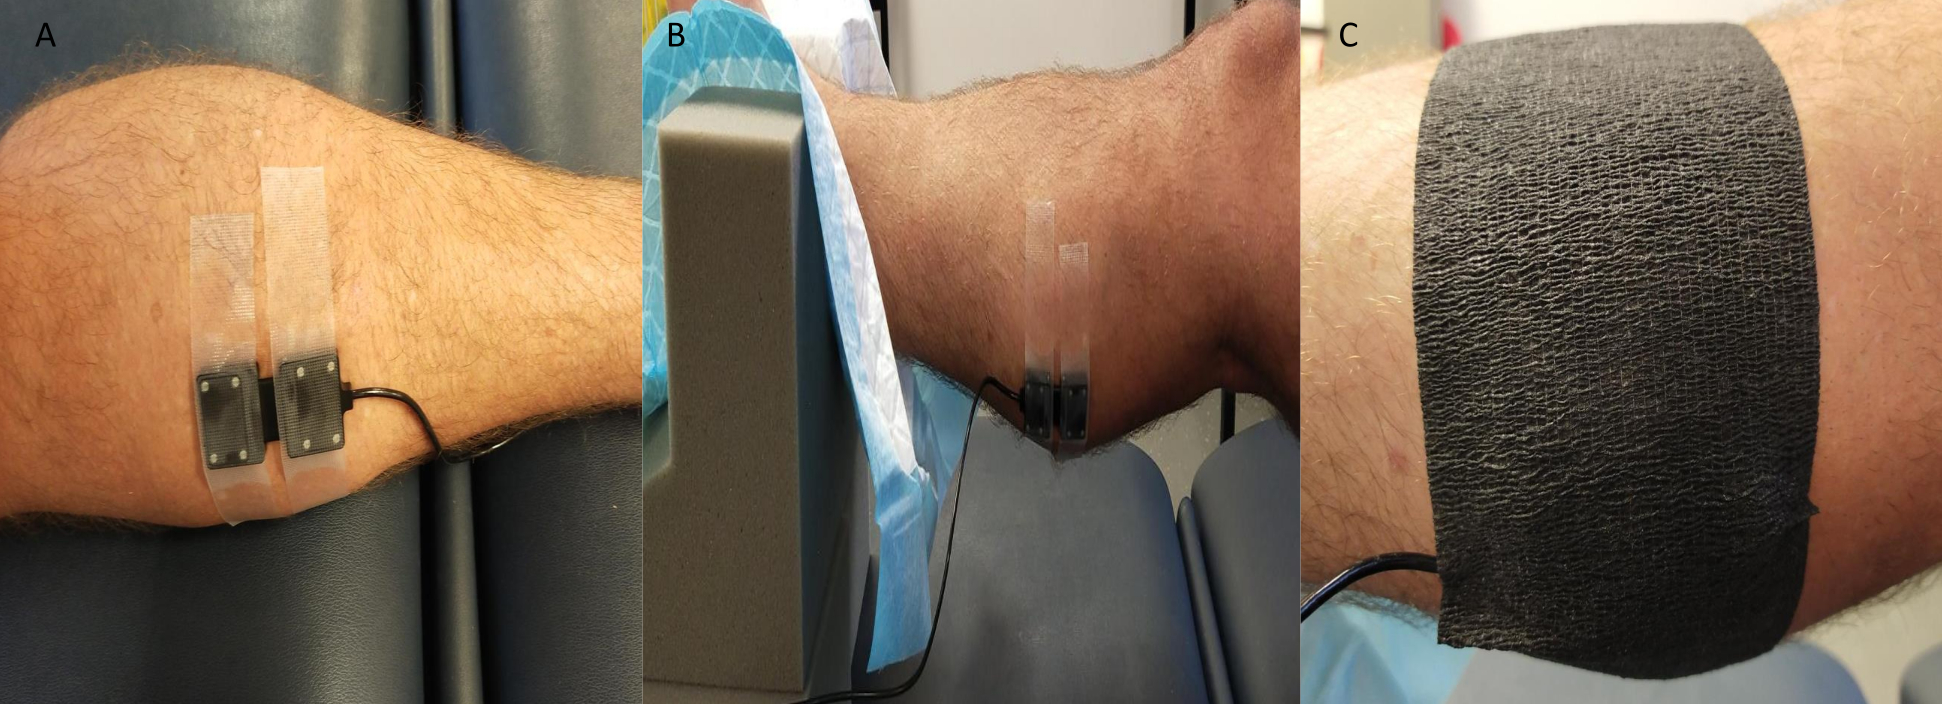
- Elevate the leg (~10 cm) with the foot and ankle on a foam support, leaving the lower leg stable and accessible for measurements (Figure 3).
NOTE: If the test is required to be conducted in both legs over multiple occasions, the test order is randomized (before initial testing), and the order of testing is maintained for subsequent assessments for each participant. - Turn on the rapid cuff inflator module.
NOTE: Ensure that the mode and pressure settings of the rapid cuff inflator are consistent with the manufacturer's instructions and vascular occlusion protocol specifications. - Turn on the cuff inflator air source, check that air can travel through the hose, and connect the hose to the thigh cuff.
- Ensure that the hose of the cuff inflator is still not in contact with the calf.
- Fix the NIRS transmitter/receiver probe securely on the skin overlying the measurement site(s) (routinely the medial aspect of the gastrocnemius; however, other sites such as the dorsum of the foot and tibialis anterior are also utilized depending on the study and participant specifics).
NOTE: Some NIRS systems allow for the possibility of multiple site measurements simultaneously. - Cover the probe with black kinesiology tape or something similar, being careful to seal the edges to prevent ambient light from affecting the NIRS signal quality/values (Figure 3).
NOTE: When fixing the probe and the adhesive covering, be sure to eliminate probe movement, but avoid compressing skin/adipose tissue/muscle.

Figure 2: Example of the occlusive cuff placement at the thigh. (A) From above. (B) From the side. Please click here to view a larger version of this figure.

Figure 3: Example of near-infrared spectroscopy probe position. (A) Probe attached to shaved skin at medial gastrocnemius. (B) Probe placement while ankle in foam support to allow access and ensure stability. (C) Ambient light shielding in place. Please click here to view a larger version of this figure.
3. Baseline data collection
- Ask the participant to remain relaxed, refrain from talking, and keep their leg(s) still for the duration of the data collection.
- Start the NIRS device recording via the computer interface.
NOTE: If offline data collection is enabled and preferred, start the NIRS device directly. - Allow for at least 2 min of data to be acquired prior to initiating the start of the measurement. This ensures steady-state signals are achieved prior to data acquisition.
- Monitor the computer screen to ensure data signal integrity and physiologically plausible values. For example, Data Acquisition (DAQ) values provide information regarding signal quality and the amount of ambient light detected by the NIRS device. They should be kept at an acceptable range throughout the measurement.
- If, after 2 min, no fluctuations in the NIRS signal are noted (e.g., due to movement artifact), set the NIRS data baseline by pushing the corresponding button on the computer/device/syncing unit. This baseline reflects the comparative starting point of the measurement. The changes in oxygenated and deoxygenated hemoglobin will be interpreted relative to this baseline.
NOTE: During data collection, insert software-based event markers of specific milestones, namely start and end of baseline, start and end of cuff occlusion etc., to assist in data analysis. - Collect at least 1 min of baseline data, again ensuring that no fluctuations or movement artifacts occur during this time.
NOTE: Fluctuations in baseline data will affect the interpretation of some potential variables, such as hyperemic reserve (see representative results section).
4. Vascular occlusion
- Set cuff pressure to 200 mmHg on the rapid cuff inflator before switching to cuff mode (or relevant setting on alternate systems).
NOTE: While some authors recommend inflation to 250 mmHg at the thigh9,19, in our experience, this is not well tolerated by some participants, leading to discontinuation of the measurement. Inflation to 200 mmHg is sufficient, in most participant groups, to occlude arterial inflow at rest while being tolerable and not resulting in bruising of the skin. To ensure effective occlusion is attained at 200 mmHg, our group routinely uses strain gauge plethysmography simultaneously with NIRS to confirm the absence of downstream blood flow during the period of cuff inflation. - Advise the participant on what to expect (discomfort, tingling sensations, etc.) during the process of inflating the cuff to 200 mmHg for a period of 5 min, followed by a total cuff deflation. Remind the participant again to remain relaxed, refrain from talking, and keep their leg(s) immobile for the duration of the data collection.
NOTE: It is our experience that the first 30-60 s of the occlusion period is the least comfortable for participants. When participants let their legs relax, they tend to find the occlusion more tolerable. - When ready to initiate cuff inflation, mark the end of the baseline period in NIRS software.
- Inflate the thigh cuff to a suprasystolic pressure of 200 mmHg, or alternatively to 220 mmHg in rare cases where 200 mmHg has proven ineffective.
- Monitor the computer or screen to ensure data integrity during the occlusion period.
- As the end of the 5 min of cuff occlusion approaches, prepare the participant by reminding them to keep their leg as still as possible and refrain from talking for approximately 3 min after cuff deflation (whilst the data from the vascular responses to reactive hyperemia are being collected).
NOTE: This reminder to the participant to remain still is important, as participants may be tempted to move the limb to relieve/ease discomfort as circulation is restored.
5. Reactive hyperemia
- After 5 min of occlusion has passed, rapidly deflate the thigh cuff completely (to 0 mmHg). Simultaneously, mark the end of the occlusive period in the NIRS software. The reactive hyperemia response, due to the resumption of blood flow and related factors, will be visible in the NIRS software display (Figure 4).
- After a minimum of 3 min post-occlusion, or alternatively, after the NIRS data has returned to baseline, mark the end of the recovery period in NIRS software and stop the measurement.
NOTE: The duration of recovery depends, in part, on the research or clinical question being investigated and, therefore, the specific NIRS parameters chosen for analysis, as well as the potential for concomitant measures (such as FMD) that may require a longer recovery duration. - Initiate data saving and exportation of NIRS results for data treatment and analysis.
6. Follow up procedures
- Remove the NIRS device(s) and cuff from the participant.
- If required, clean the NIRS device (and occlusion cuff) following manufacturer's instructions and relevant hygiene standards.
- Inspect the NIRS device to ensure transmitter/receiver integrity and battery performance for future measurements.
Results
Near-infrared spectroscopy
Continuous wave near-infrared spectroscopy devices measure relative changes in oxygenated (O2Hb) and deoxygenated (HHb) hemoglobin, which reflect local O2 delivery and utilization via light-emitting sources and photodetectors, set specific distances apart. Wavelengths of light between ~700 nm and 850 nm are emitted, corresponding with the peak absorbency of O2Hb and HHb. Once near-infrared light has penetrated skeletal muscle...
Discussion
This article outlines standardized procedures for the assessment of lower limb reactive hyperemia using CW-NIRS TSI to evaluate microvascular function. This protocol has been refined by examination of cuff occlusion duration on response magnitude, NIRS test-retest reliability during reactive hyperemia, as well as the level of agreement between NIRS and other methods of microvascular evaluation such as contrast-enhanced ultrasound23,24. A longer cuff-occlusion dur...
Disclosures
The authors have no disclosures or competing interests.
Acknowledgements
The authors would like to acknowledge Dr A. Meneses, whose previous work contributed to the refinement of the protocol described herein. Additionally, the authors would like to thank all of the research participants who have donated their time to enable protocols such as this to be developed in order to further clinical and scientific understanding.
Materials
| Name | Company | Catalog Number | Comments |
| Cuff Inflator Air Source | Hokanson | AG101 AIR SOURCE | |
| Elastic Cohesive Bandage | MaxoWrap | 18228-BL | For blocking out ambient light |
| OxySoft | Artinis | 3.3.341 x64 | |
| PortaLite (NIRS) | Artinis | 0302-00019-00 | |
| PortaSync MKII (Remote) | Artinis | 0702-00860-00 | For Marking milestones during measurement |
| Rapid Cuff Inflator | Hokanson | E20 RAPID CUFF INFLATOR | |
| Thigh Cuff | Hokanson | CC17 | |
| Transpore Surgical Tape | 3M | 1527-1 | For fixing probe to skin |
References
- Hasani, W. S. R., et al. The global estimate of premature cardiovascular mortality: A systematic review and meta-analysis of age-standardized mortality rate. BMC Public Health. 23 (1), 1561 (2023).
- Horvath, L., et al. Epidemiology of peripheral artery disease: Narrative review. Life (Basel). 12 (7), 1041 (2022).
- Jodheea-Jutton, A., Hindocha, S., Bhaw-Luximon, A. Health economics of diabetic foot ulcer and recent trends to accelerate treatment). Foot (Edinb). 52, 101909 (2022).
- Rodrigues, B. T., Vangaveti, V. N., Urkude, R., Biros, E., Malabu, U. H. Prevalence and risk factors of lower limb amputations in patients with diabetic foot ulcers: A systematic review and meta-analysis. Diabetes Metab Syndr-Clinin Res Rev. 16 (2), 102397 (2022).
- Jung, F., et al. Microcirculation in hypertensive patients. Biorheology. 50 (5-6), 241-255 (2013).
- Bethel, M., Annex, B. H. Peripheral arterial disease: A small and large vessel problem. AmHeart J Plus: Cardio Res Prac. 28, 133291 (2023).
- Thijssen, D. H. J., et al. Expert consensus and evidence-based recommendations for the assessment of flow-mediated dilation in humans. Eur Heart J. 40 (30), 2534-2547 (2019).
- Sanada, H., et al. Vascular function in patients with lower extremity peripheral arterial disease: A comparison of functions in upper and lower extremities. Atherosclerosis. 178 (1), 179-185 (2005).
- Barstow, T. J. Understanding near-infrared spectroscopy and its application to skeletal muscle research. J App Phys. 126 (5), 1360-1376 (2019).
- Rogers, E. M., Banks, N. F., Jenkins, N. D. M. Metabolic and microvascular function assessed using near-infrared spectroscopy with vascular occlusion in women: Age differences and reliability. Exp Physiol. 108 (1), 123-134 (2023).
- Manfredini, F., et al. A toe flexion nirs assisted test for rapid assessment of foot perfusion in peripheral arterial disease: Feasibility, validity, and diagnostic accuracy. Eur J Vasc Endovasc Surg. 54 (2), 187-194 (2017).
- Boezeman, R. P., Moll, F. L., Unlu, C., De Vries, J. P. Systematic review of clinical applications of monitoring muscle tissue oxygenation with near-infrared spectroscopy in vascular disease. Microvasc Res. 104, 11-22 (2016).
- Baltrunas, T., et al. Measurement of revascularization effect using near-infrared spectroscopy in below the knee arteries. Rev Cardiovasc Med. 23 (9), 299 (2022).
- Tuesta, M., Yanez-Sepulveda, R., Verdugo-Marchese, H., Mateluna, C., Alvear-Ordenes, I. Near-infrared spectroscopy used to assess physiological muscle adaptations in exercise clinical trials: A systematic review. Biology (Basel). 11 (7), 1073 (2022).
- Cornelis, N., et al. The use of near-infrared spectroscopy to evaluate the effect of exercise on peripheral muscle oxygenation in patients with lower extremity artery disease: A systematic review. Eur J Vasc Endovasc Surg. 61 (5), 837-847 (2021).
- Whyte, E., Thomas, S., Marzolini, S. Muscle oxygenation of the paretic and nonparetic legs during and after exercise in chronic stroke: Implications for mobility. PM R. 15 (10), 1239-1248 (2023).
- Soares, R. N., George, M. A., Proctor, D. N., Murias, J. M. Differences in vascular function between trained and untrained limbs assessed by near-infrared spectroscopy. Eur J Appl Physiol. 118 (10), 2241-2248 (2018).
- Joseph, S., et al. Near infrared spectroscopy in peripheral artery disease and the diabetic foot: A systematic review. Diabetes Metab Res Rev. 38 (7), 3571 (2022).
- Willingham, T. B., Southern, W. M., Mccully, K. K. Measuring reactive hyperemia in the lower limb using near-infrared spectroscopy. J Biomed Opt. 21 (9), 091302 (2016).
- Jones, S., Chiesa, S. T., Chaturvedi, N., Hughes, A. D. Recent developments in near-infrared spectroscopy (nirs) for the assessment of local skeletal muscle microvascular function and capacity to utilise oxygen. Artery Res. 16, 25-33 (2016).
- Soares, R. N., et al. Effects of a rehabilitation program on microvascular function of CHD patients assessed by near-infrared spectroscopy. Physiol Rep. 7 (11), e14145 (2019).
- Baltrunas, T., et al. The use of near-infrared spectroscopy in the diagnosis of peripheral artery disease: A systematic review. Vascular. 30 (4), 715-727 (2022).
- Young, G. M., et al. Influence of cuff-occlusion duration on contrast-enhanced ultrasound assessments of calf muscle microvascular blood flow responsiveness in older adults. Exp Physiol. 105 (12), 2238-2245 (2020).
- Young, G. M., et al. The association between contrast-enhanced ultrasound and near-infrared spectroscopy-derived measures of calf muscle microvascular responsiveness in older adults. Heart Lung Circ. 30 (11), 1726-1733 (2021).
- Rosenberry, R., Nelson, M. D. Reactive hyperemia: A review of methods, mechanisms, and considerations. Am J Physiol Regul Integr Comp Physiol. 318 (3), R605-R618 (2020).
- Iannetta, D., et al. Reliability of microvascular responsiveness measures derived from near-infrared spectroscopy across a variety of ischemic periods in young and older individuals. Microvasc Res. 122, 117-124 (2019).
- Celermajer, D. S., et al. Non-invasive detection of endothelial dysfunction in children and adults at risk of atherosclerosis. Lancet. 340 (8828), 1111-1115 (1992).
- Thijssen, D. H. J., et al. Assessment of flow-mediated dilation in humans: A methodological and physiological guideline. Am J Physiol-Heart Circ Physiol. 300 (1), H2-H12 (2011).
- Inaba, Y., Chen, J. A., Bergmann, S. R. Prediction of future cardiovascular outcomes by flow-mediated vasodilatation of brachial artery: A meta-analysis. Int J Cardiovasc Imaging. 26 (6), 631-640 (2010).
- Soares, R. N., De Oliveira, G. V., Alvares, T. S., Murias, J. M. The effects of the analysis strategy on the correlation between the NIRS reperfusion measures and the FMD response. Microvasc Res. 127, 103922 (2020).
- Tucker, W. J., et al. Studies into the determinants of skeletal muscle oxygen consumption: Novel insight from near-infrared diffuse correlation spectroscopy. J Physiol-London. 597 (11), 2887-2901 (2019).
- Tucker, W. J., et al. Near-infrared diffuse correlation spectroscopy tracks changes in oxygen delivery and utilization during exercise with and without isolated arterial compression. Am J Physiol Regul Integr Comp Physiol. 318 (1), R81-R88 (2020).
- Wassenaar, E. B., Van Den Brand, J. G. Reliability of near-infrared spectroscopy in people with dark skin pigmentation. J Clinic Monit Comput. 19 (3), 195-199 (2005).
- Soares, R. N., Murias, J. M. Near-infrared spectroscopy assessment of microvasculature detects difference in lower limb vascular responsiveness in obese compared to lean individuals. Microvasc Res. 118, 31-35 (2018).
- Boezeman, R. P., et al. Monitoring of foot oxygenation with near-infrared spectroscopy in patients with critical limb ischemia undergoing percutaneous transluminal angioplasty: A pilot study. Eur J Vasc Endovasc Surg. 52 (5), 650-656 (2016).
- Lin, B. S., et al. Using wireless near-infrared spectroscopy to predict wound prognosis in diabetic foot ulcers. Adv Skin Wound Care. 33 (1), 1-12 (2020).
- Weingarten, M. S., et al. Diffuse near-infrared spectroscopy prediction of healing in diabetic foot ulcers: A human study and cost analysis. Wound Repair. 20 (2), A44-A44 (2012).
- Murrow, J. R., et al. Near-infrared spectroscopy-guided exercise training for claudication in peripheral arterial disease. Eur J Prev Cardiol. 26 (5), 471-480 (2018).
Reprints and Permissions
Request permission to reuse the text or figures of this JoVE article
Request PermissionThis article has been published
Video Coming Soon
Copyright © 2025 MyJoVE Corporation. All rights reserved