Turbidity and Total Solids in Surface Water
Source: Laboratories of Margaret Workman and Kimberly Frye - Depaul University
Turbidity and total solids are related measurements addressing clarity of surface waters. Turbidity is an indirect measure of water clarity that determines the amount of light that can pass through the water. Total solids is a direct measurement of solid particles suspended in water determined by weight.
High levels of turbidity and total solids are caused by soil erosion, waste discharge, runoff, or changes in ecological communities including algal growth or abundance of benthic organisms that can disrupt sediments up into the water. Higher levels of turbidity and suspended solids can lower water quality by absorbing heat causing an increase in water temperature and a decrease in oxygen levels (warm water holds less oxygen). These conditions can also cause a decrease in photosynthesis as less sunlight penetrates the water, making the water unable to support some aquatic life. Suspended solids can also clog gills, smother eggs, reduce growth rates, and disrupt microhabitats of many aquatic organisms.
One method of measuring turbidity includes using a Secchi disk. A Secchi disk is a metal disk with alternate black and white quarters (Figure 1). It is attached to a rope that has one-foot markings along it. The disk is dropped into water until it can no longer be seen (Figure 2). The drawback of this method is that it must be done in the field and ideal protocol requires sunny conditions and that the testing area be shaded. In addition, if there is a large distance between the riverbank and the water level, it is difficult to use the Secchi disk. By using turbidity tubes, one can collect water and then perform the turbidity measurements back in the laboratory.
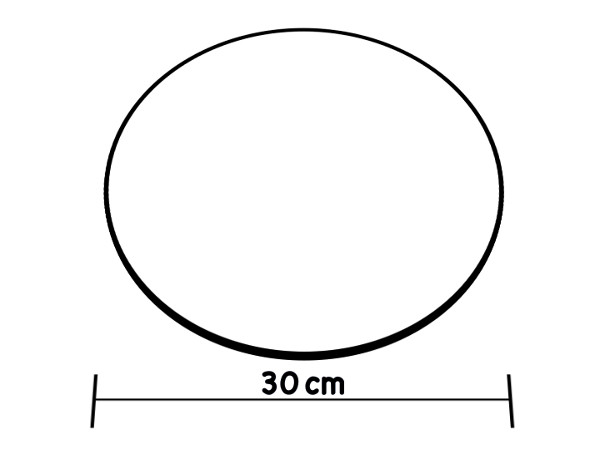
Figure 1. The modified Secchi disk design used in freshwater.
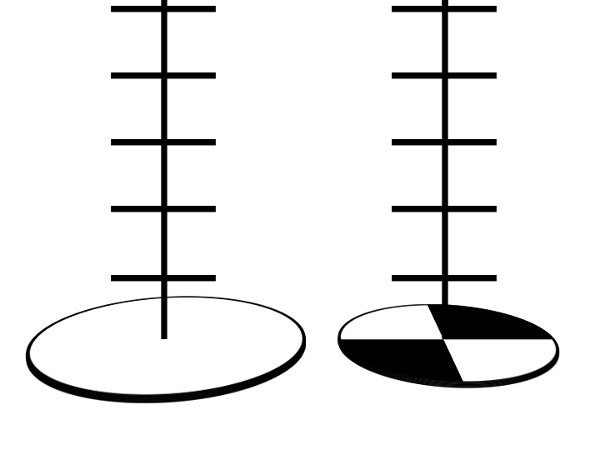
Figure 2. Different kinds of Secchi disk. A marine style one on the left and the freshwater version on the right
1. Measuring Turbidity
- Pour mixed sample water into one turbidity column and fill to the 50-mL line with the sample water.
- Fill the second “Blank” Turbidity Column with deionized water to the 50-mL line.
- Place the two tubes side by side and note the difference in clarity. If the black dot is equally clear in both tubes, the turbidity is zero. If the black dot in the sample tube is less clear, proceed to next step.
- Shake the Standard Turbidity Reagent.
- Add 0.
The table below is used to convert amount of reagents into the turbidity units (JTU). (Table 1)
TURBIDITY
Excellent < 10 JTUs
Good 11 – 20 JTUs
Fair 21 – 90 JTUs
Poor > 90 JTUs
Total solids can be assessed using the Water Quality Monitoring Quantitative Analysis categories for total solids measurements.
TOTAL SOLIDS (mg/L)
Excellent <100
Good 101 – 250
Fair 251 – 400
Poor > 400


