A subscription to JoVE is required to view this content. Sign in or start your free trial.
Method Article
Novel Quantification Protocol for Cardiovascular Calcification Progression Using Longitudinal MicroPET/MicroCT Images
In This Article
Summary
This novel protocol entails the quantification of cardiovascular calcification progression from serial micro positron emission tomography (PET)/micro computed tomography (CT) images in small research animals.
Abstract
Micro positron emission tomography (PET) and micro computed tomography (CT) imaging are powerful, ideal research tools for following the progression of cardiovascular calcification. Due to their non-invasive nature, small research animals can be imaged at multiple time points. The challenge lies in the accurate quantification of cardiovascular calcification. Here, we provide a protocol, using images from the later disease stages as a template, to accurately quantify the progression of cardiovascular calcification in longitudinal studies. The protocol involves 1) the alignment of the chest area in multiple images from the same animal during a longitudinal study as the first step, 2) the definition of a region of interest (ROI) situated within the heart and the aorta at the site of larger calcium deposits that become apparent in later images, and 3) simultaneous segmentation and quantification of calcium deposits across all images acquired during the longitudinal study. This streamlined method enhances the accuracy of image analysis in following the progression of cardiovascular calcification by improving the precision of ROI definition and reducing the variability associated with earlier techniques that analyze individual scans independently.
Introduction
Cardiovascular disease is a leading global cause of morbidity and mortality, demanding rigorous exploration to uncover its mechanisms and to devise effective preventive and therapeutic strategies. Coronary artery calcification (CAC) is widely acknowledged by the experts in the field as a predictive factor for cardiovascular disease, significantly elevating the risk of cardiovascular mortality1,2,3,4,5. Microscopic calcifications are considered the earliest stages of calcific atherosclerosis, and the term "microcalcifications" has been used to refer to calcium deposits between 0.5 to 50 µm6,7,8,9 in diameter. These small calcifications are believed to coalesce to form larger calcium deposits, fueling the progression of calcific plaque6,7.
Positron emission tomography (PET) and computed tomography (CT) serve as valuable research tools, frequently employed for the non-invasive assessment of cardiovascular calcification in vivo5,10,11,12,13,14,15,16,17,18,19. These imaging modalities prove particularly advantageous for tracking vascular calcification progression in longitudinal studies involving small research animals11,12,13,19. MicroCT imaging has demonstrated effectiveness in providing anatomical images of relatively large calcium deposits11,12,13,19,20. However, its utility for imaging small calcium deposits in living animals is constrained by its spatial resolution of ~100 µm8,14, making it challenging to investigate calcification during its initial phases.
A notable advancement is the adoption of combined microPET/microCT imaging with the PET tracer, fluoride-18-labeled sodium fluoride (18F-NaF), as the standard method for the detection of calcification based on its binding to the mineral surface area. This approach uses radiolabeled 18F-NaF, shown to identify the calcium mineral surface10,13 as the fluoride ions bind covalently to calcium hydroxyapatite, replacing hydroxyl groups to form fluoroapatite21. Consistent with the slower exchange rate relative to the radioactive decay of the 18F (half-life ~110 min) and to the clearance of the tracer through kidneys22, Irkle and colleagues13 found that 18F-NaF binding to calcified carotid specimens was limited to the surface at the time of detection. Thus, tracer uptake should relate directly with mineral surface area, which is greater when a given amount of mineral occurs in multiple small foci or in porous form than when present in few, large, solid deposits. By accentuating the earliest stages of mineralization with high sensitivity, 18F-NaF PET imaging may provide valuable insights into the early stages of disease, making it particularly useful in studying preventive as well as therapeutic strategies13,14,15.
Even with recent advancements in the combined microPET/microCT imaging of vascular calcification, there are opportunities for improving the accuracy of image analysis in longitudinal, cardiovascular calcification studies. Conventional approaches use labor-intensive, manual delineation of regions of interest (ROI) around each visible calcified region in every mouse at each individual time point throughout the longitudinal study. This method reduces precision, particularly in the early disease stages when the sizes of calcium deposits approach the scanners' detection limits, potentially making invisible some areas with minuscule deposits arranged in low density.
In the realm of imaging, alignment generally refers to the spatial alignment of a series of images. Introducing alignment as a novel solution to the existing challenges, our proposed method allows investigators to use a consistent location for following the progression of calcification in serial images from individual subjects throughout a longitudinal study. Given that tissue calcification is known to arise from nanosized matrix vesicles (50-150 nm), which coalesce to form microscopic, then macroscopic hydroxyapatite mineral23, one may retrospectively identify where microcalcifications would have been located in early images before they are discernable.
Following that same location over time, made possible by image alignment, is the basis for this method. It obviates the need to identify the earliest calcification stages directly, as the ROI is assigned based on the latest stages when mineralization is readily identified. In this protocol, we present an improved, streamlined data analysis method that incorporates the alignment of a time series of images as a vital step, enhancing accurate quantitation of calcium deposition in longitudinal, combined, microPET/microCT imaging studies (Figure 1). While we use PET/CT data analysis as an example, this method can be applied to the analyses of other longitudinal imaging data, including single photon emission computed tomography (SPECT), magnetic resonance imaging (MRI), and optical imaging24.
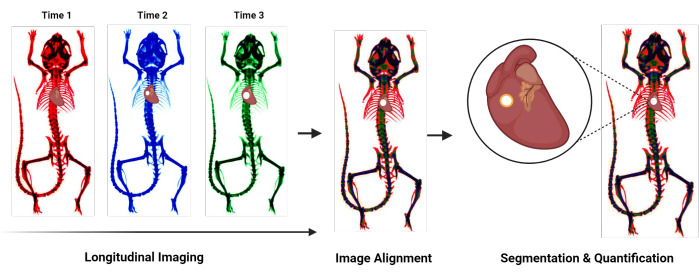
Figure 1: Protocol overview flowchart. Flowchart summarizing the novel protocol for quantifying cardiovascular calcification. General steps include longitudinal imaging, alignment of images acquired at different time points, and segmentation and quantification of the calcified region. Please click here to view a larger version of this figure.
Protocol
The representative images present a female apolipoprotein-E-deficient (Apoe-/-) mouse. Experimental protocols were reviewed and approved by the Institutional Animal Care and Use Committee of the University of California, Los Angeles.
1. Animal scanning
- Between the two image acquisitions, feed the mouse with a standard diet without any intervention. However, prior to the first image at 15 months of age, switch to a Western diet (21% fat, 0.2% cholesterol) from 12 through 14 months of age to induce baseline aortic calcification.
- Ensure that the microPET/CT scanner is routinely calibrated for optimal PET data acquisition and CT co-registration. Perform the calibrations according to the manufacturer's instructions.
- Anesthetize the mouse using 2% isoflurane gas in a chamber for 10 min before imaging. Confirm anesthesia by pinching the toe of the animal without response.
- Acquire microPET (350-650 keV, 10 min scan time) and 100 µm microCT (80 kVp, 150 µA, 720 projection, 1 min scan time) images in a combined microPET/CT scanner 60 min after the intravenous injection of 3.7 MBq of 18F-NaF. Acquire the microCT scans immediately following the microPET scans.
NOTE: The scanner bed moved the animal from the PET modal to the CT modal while the animal remained under anesthesia and in the same position. - Reconstruct microPET images using a 3D-ordered subset expectation maximization algorithm (24 subsets and 3 iterations), with random, attenuation, and decay correction. Reconstruct the CT images using a Modified Feldkamp Algorithm.
NOTE: After imaging, the mouse was monitored until it regained sufficient consciousness to maintain sternal recumbency. At the end of the longitudinal study, all mice were euthanized.
2. Import DICOM files in DICOM viewer software
NOTE: While this representative protocol uses ORS Dragonfly software under a non-commercial license, its flexibility extends to other DICOM viewer software options.
- Launch the DICOM viewer software by double-clicking the application.
- Navigate to File in the upper left corner. In the dropdown menu, select Import DICOM Images… to prompt the appearance of the Manage DICOM Images window (Supplemental File 1- Supplemental Figure S1A).
- Within the Manage DICOM Images window, click on the Folder Contents tab. On the right side, select Open Folder… to choose the folders containing the DICOM files of interest in a longitudinal study (Supplemental File 1- Supplemental Figure S1B).
- Identify the folders containing the DICOM files. Click Select Folder to import the first folder to the Manage DICOM Images window (Supplemental File 1- Supplemental Figure S1C).
- Select both PET ("PT") and CT ("CT") DICOM files in the Manage DICOM Images window. Subsequently, click on View Study on the right side to open all the imported DICOM images (Supplemental File 1- Supplemental Figure S1D).
- Repeat steps 2.4 and 2.5 for each folder containing DICOM images related to the same single subject in the longitudinal study.
3. Adjust DICOM viewer settings to optimize image visualization
- Change the layout to display four views (3D, transverse, coronal, sagittal), as illustrated in Supplemental File 1- Supplemental Figure S2. Within the Layout dropdown on the left-hand side, find Views (in the selected scene) and select a layout that displays four views.
- Rename images to indicate time points and whether they are PET or CT images. Select the image name and double click to rename each image.
- Turn on an image by accessing the Data Properties and Settings dropdown on the right side. Click the eye icon to the left of each image name to toggle visibility (Supplemental File 1- Supplemental Figure S2)
- Adjust the brightness and contrast on each CT image, individually.
NOTE: The optimal CT brightness and contrast range may vary depending on the subject, imaging protocol, scanner, and reconstruction parameters25,26; however, all adjustments should be consistent for a single subject in a longitudinal study.- Select and turn on one CT image by clicking on the image name under Data Properties and Settings (Supplemental File 1- Supplemental Figure S2).
- Find the histogram within the Window Leveling dropdown located in the Main tab on the left side of the display screen. Activate LogY above the histogram; then, proceed to click and slide the yellow range indicators to completely encompass the second peak in the histogram (Supplemental File 1- Supplemental Figure S3A). Make slight adjustments until optimal brightness/contrast is reached; reference Figure 2B for an example of a brightness/contrast adjusted CT image.
- Find the Selected Range box under the Window Leveling histogram (Supplemental File 1- Supplemental Figure S3B). Take note of the Selected Range values to use in succeeding steps.
- Select and turn on a second CT image (Supplemental File 1- Supplemental Figure S3C). Input the selected range values from the first CT image into the Selected Range box for the second CT image (Supplemental File 1- Supplemental Figure S3B-S3D). Repeat for all consecutive images.
- Refine each PET image by adjusting the Lookup Table filter, individually.
NOTE: The optimal PET color scale range may vary depending on the subject, imaging protocol, scanner, and reconstruction parameters27; however, all adjustments should be consistent for a single subject in a longitudinal study.- Select and turn on one PET image by clicking on the image name under Data Properties and Settings (Supplemental File 1- Supplemental Figure S2).
- Under the Window Leveling dropdown in the Main tab, locate Lookup Table (LUT) and scroll to find PET under the LUT dropdown and select the PET filter (Supplemental File 1- Supplemental Figure S4A).
- Fine-tune the selected range using the histogram under the Window Leveling dropdown to achieve an optimal visualization. Activate LogY above the histogram; then, proceed to click and slide yellow range indicators toward the position shown in Supplemental Figure S4B (Supplemental File 1). Make slight adjustments until optimal selected range is achieved for PET image visualization; reference Figure 2D for an example of a PET/CT image adjusted for optimal selected range.
- Find the Selected Range dropdown under the Window Leveling histogram (Supplemental File 1- Supplemental Figure S4B). Take note of the selected range values to use in succeeding steps.
- Select and turn on a second PET image (Supplemental File 1- Figure S4C). Repeat step 3.5.2 for the second image.
- Input the selected range values from the first PET image into the Selected Range box for the second PET image (Supplemental File 1- Figure S4B-S4D). Repeat for all consecutive images.
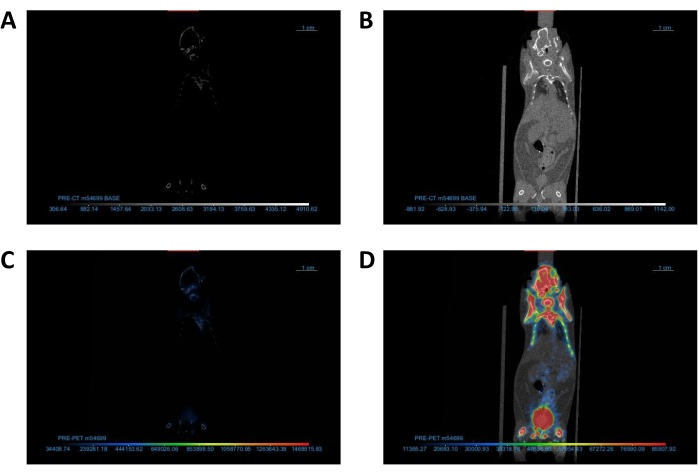
Figure 2: Adjustment of DICOM viewer settings to optimize image visualization. (A,B) Coronal view of CT images (A) before and (B) after contrast/brightness adjustment. (C,D) Coronal view of PET/CT images (C) before and (D) after Lookup Table adjustment. Abbreviations: CT = computed tomography; PET = positron emission tomography. Please click here to view a larger version of this figure.
4. Align the chest area in CT images
NOTE: For simplicity, one CT image will serve as the "base" image and will not be translated or rotated. The second CT image (and eventually subsequent serial images) will be translated and/or rotated to align with the base image; this will be called the "overlay" image for the purpose of the demonstration. Throughout alignment, it is important to distinguish between the base image and all other overlay images.
- Turn off all PET images and turn on the base CT image by clicking the eye icon to the left of each image name under the Data Properties and Settings dropdown.
- Change the opacity of the CT image to ~50%. Click on one of the 2D views. Under the Window Leveling box, find the Opacity Mapping dropdown and slide the Opacity scale to the center (Supplemental File 1- Figure S5).
- Turn on the overlay CT image and repeat step 4.2.
- Change the filter of the overlay CT image to distinguish between the base CT image and the overlay CT image. Under the Window Leveling dropdown in the Main tab, find Lookup Table (LUT). Under the LUT dropdown, scroll and click on the red filter.
NOTE: There should now be two CT images in each view as illustrated in Supplemental Figure S5 (Supplemental File 1). - Use Translate/Rotate tools in 2D views to align the chest area in the overlay image as close as possible to that in the base image. Refer to the thoracic cage, upper spine, and sternum as chest alignment indicators in CT image.
NOTE: The following actions can only be executed in 2D views (Transverse, Coronal, or Sagittal) (Supplemental File 1- Supplemental Figure S1). For the best outcome, switch between all three 2D views and use the translate/rotate tools to align the chest area in each view.- Select the overlay image in the Data Properties and Settings dropdown and click once to select one of the 2D views.
- Find the Translate/Rotate dropdown under the Main tab and click the Displace icon (Supplemental File 1- Figure S6A).
- Click and drag on the translate box in the lower left corner and rotate the pivot point in the center of the selected 2D view to move the overlay image to roughly align with the base image (Supplemental File 1 - Supplemental Figure S6B). Refer to bone structures for reference of alignment.
- Find the Track tool under the Manipulate dropdown and move the axis to the chest area by clicking and dragging the center of the axis. Zoom in on the chest area by clicking the middle scroll button on the computer mouse and dragging the mouse away from the screen (Supplemental File 1 - Supplemental Figure S6C).
- Fine-tune the alignment for precise positioning with chest structures such as the thoracic cage, upper spine, and sternum through further translation and rotation adjustments. Switch between 2D views and repeat steps 4.5.3-4.5.4 until the two images are aligned to resemble Figure 3.
- After the base and first overlay CT images are aligned, change the filter of the overlay CT image back to grayscale under the LUT dropdown. Repeat section 4 for all overlay CT images from the same animal, using a constant base image.
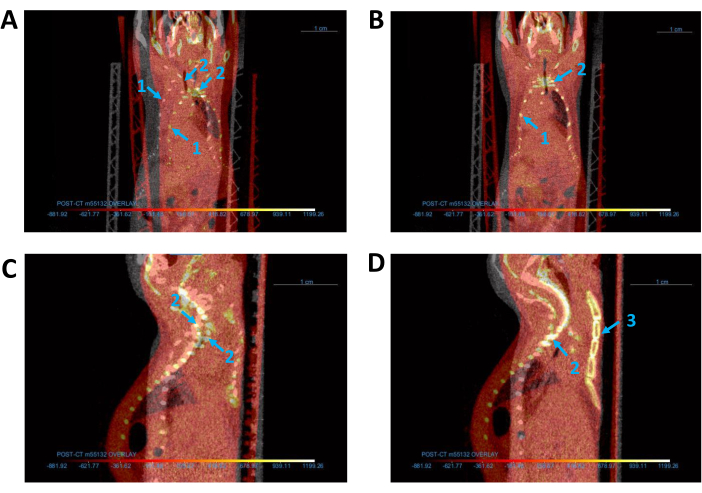
Figure 3: Alignment of all CT images. (A,B) Coronal view of base (gray) and overlay (red) CT images (A) before and (B) after alignment. (C,D) Sagittal view of CT images (C) before and (D) after alignment. Blue arrows indicate the mouse (1) thoracic cage, (2) spine, and (3) sternum. Abbreviation: CT = computed tomography. Please click here to view a larger version of this figure.
5. Co-register PET images with corresponding CT images
NOTE: Alignment of the overlay CT image and base CT image will initially result in misalignment of the overlay CT image with its respective PET image seen in Figure 4. The PET image needs to be co-registered with its corresponding CT image once again.
- Turn on the overlay CT image and its respective PET image by clicking the eye icon to the left of each image name.
- Change the opacity of the PET and CT images to ~50%. Under the Window Leveling drop down, find the Opacity Mapping dropdown and slide the Opacity scale to the center (Supplemental File 1 - Supplemental Figure S5).
- Use Translate/Rotate tools in 2D views to align the PET image with its corresponding CT image, based on the bone structure in the CT image and the 18F-NaF bone surface in the PET image.
- Select the PET image corresponding to the overlay CT image in the Data Properties and Settings drop down and click once to select one of the 2D views.
- Find the Translate/Rotate dropdown under the Main tab and click the Displace icon (Supplemental File 1 - Supplemental Figure S6A).
- Click and drag on the translate box in the lower left corner and rotate the pivot point in the center of the selected 2D view (Supplemental File 1 - Supplemental Figure S6B) to move the PET image to co-register with the CT image.
- Repeat section 5 for all overlay PET and CT images that are not co-registered with their CT images.
NOTE: If co-registration is complete, the corresponding PET/CT images should be aligned along the entire length of the body, as shown in Figure 4.
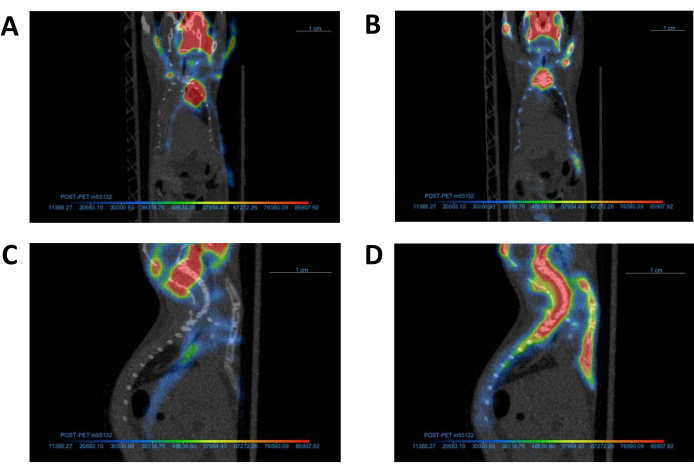
Figure 4: Alignment of PET images with corresponding CT image. A representative PET image and its corresponding CT image (A, C) before and (B, D) after co-registration. Following completion of co-registration, the PET and CT images should be aligned as demonstrated in Panel B. Abbreviations: CT = computed tomography; PET = positron emission tomography. Please click here to view a larger version of this figure.
6. Identify cardiovascular calcification
- Identify the time point with the largest predicted calcified regions in the longitudinal study (i.e., late calcification time point or pretreated subjects). Select the image corresponding to this time point to serve as the "reference" image, emphasizing the most distinctly visible calcification. This chosen image will then function as a template for comparison with all other images containing smaller calcification areas at different time points.
- Turn on the reference CT image by clicking the eye icon to the left of the image. Select the Track tool under the Manipulate dropdown and move the axis center around the cardiac region.
- Zoom in to find the calcified regions (small bright dense sites) superimposed over the cardiac silhouette between the thoracic cage, sternum, and spine (Figure 5). If the calcified regions are not immediately visible, scroll through layers of each image by selecting a 2D view and scrolling with the mouse.
- Move the Track axis to hover over the calcified region, ensuring its visibility across all 2D views. For a visual reference of calcification regions in a mouse CT image, consult Figure 5.
- Turn on the corresponding PET image to validate the presence of calcification.
NOTE: If the PET image settings and co-registration were appropriately adjusted, the PET image should display activity around the calcified region, as exemplified in Figure 5D.
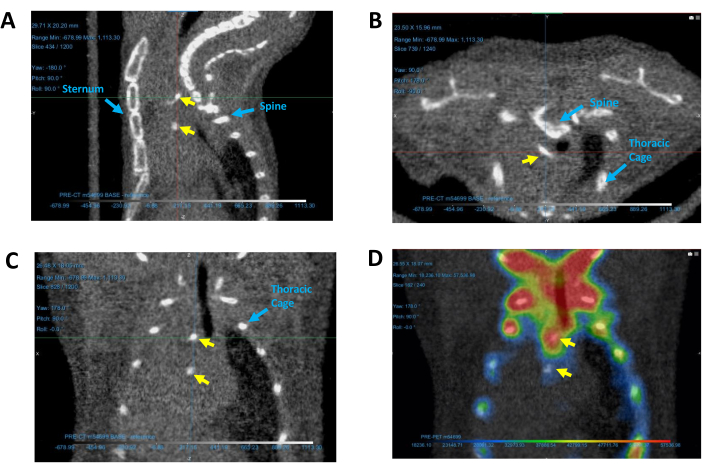
Figure 5: Identifying calcified regions in the heart. Calcification regions depicted in representative (A) sagittal, (B) transverse, and (C) coronal CT images, as well as (D) a coronal PET/CT image. Yellow arrows indicate calcium deposits. Blue arrows identify reference structures used for determining the location of calcification. Abbreviations: CT = computed tomography; PET = positron emission tomography. Please click here to view a larger version of this figure.
7. Draw ROIs around the calcified regions
- Turn off the PET reference image. Turn on only the CT reference image by clicking the eye icon to the left of the image.
- Find the Shapes dropdown and choose the Sphere shape (Supplemental File 1 - Supplemental Figure S7). Adjust the sphere's dimensions by clicking and dragging its edges to modify size. Re-position the sphere by clicking and dragging the center square.
- Navigate through the 2D views to carefully position the sphere. The sphere should encapsulate the entire identified calcification region and some surrounding area but avoid any surrounding bones. For a visual guide on optimal sphere drawing, refer to Supplemental Figure S7 (Supplemental File 1) for proper placement of the sphere.
- In the Data Properties and Settings dropdown, right-click on the sphere name and choose Add to ROI… (Supplemental File 1 - Supplemental Figure S8A), followed by selecting New ROI (Supplemental File 1 - Supplemental Figure S8B).
- Assign an appropriate name to the newly created ROI. Under Geometry, select the CT image for which an ROI is to be generated (Supplemental File 1 - Supplemental Figure S8C).
- Turn on the ROI by clicking the eye icon to the left of the ROI name and observe a colored ROI corresponding to the size of the previously drawn sphere, as illustrated in Supplemental Figure S8D (Supplemental File 1).
- Find the Segment tab to the left of the display screen, next to the main tab (Figure 6A). The Segment tab allows creation and editing of ROIs.
NOTE: The following three steps are geared towards the creation of an ROI with a precision that exclusively highlights calcified areas within the designated sphere.- Select the reference ROI in the Data Properties and Settings and locate the Range dropdown under the Segment tab. Click to check on Define range (Figure 6A).
- Change the defined range using the Selected Range box (Figure 6A). Ensure that the defined range encapsulates all non-calcified pixels with Hounsfield unit (HU) values below the calcium threshold. This demonstration uses a threshold of 300 HU for calcium, and the lowest density pixel in this image is -2,626; therefore, the selected range is -2,626-300 HU.
- Once the selected range is configured, click Remove (Figure 6A) to eliminate all pixels beneath the specified threshold from the sphere ROI.
NOTE: This action results in a new ROI that exclusively highlights the calcified regions within the sphere, streamlining the focus for further analysis. Completed ROIs should resemble the ROI depicted in Figure 6B.
- Repeat steps 7.3-7.4 for all consecutive CT images to create unique new ROIs using a common reference sphere. Name each ROI to correspond with the identification of its specific CT image, ensuring a concise and organized analysis.
NOTE: It should NOT be necessary to create a new sphere for the ROI analysis of each image because the reference sphere should encapsulate the largest calcified region of all images, assuming the alignment is accurate.
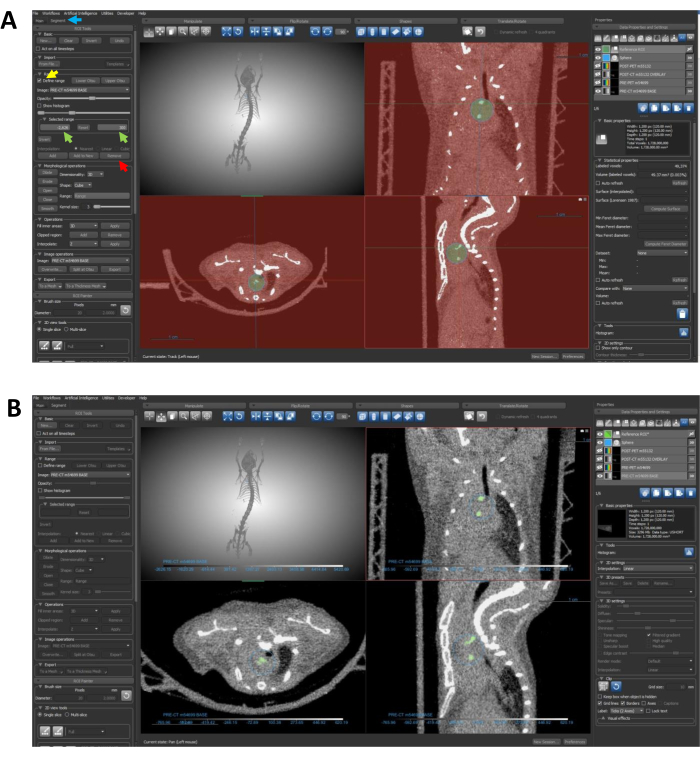
Figure 6: Using segmentation to restrict the ROI to calcified regions. (A) The arrows guide through the steps required to eliminate undesired density data from the ROI. The blue arrow points to the Segment tab; the yellow arrow highlights the Define Range feature; green arrows indicate the selected range inputs; and the red arrow points to the Remove button. (B) Following completion of protocol steps 7.4-7.4.3, the ROI should specifically delineate the calcified regions, as depicted in this panel. Abbreviation: ROI = region of interest. Please click here to view a larger version of this figure.
8. Quantify the ROI for each image
- Select the ROI to be quantified under the Data Properties and Settings dropdown.
- Find the Statistical properties dropdown on the right side below the Basic Properties dropdown (Figure 7).
- Locate the Dataset table under Statistical Properties. Using the dropdown menu on the right, choose the appropriate imaging dataset that correlates with the ROI to be quantified (Figure 7).
- When quantifying the CT data within the ROI, choose the CT image name that correlates with the ROI.
- When quantifying the PET data within the ROI, choose the PET image name that corresponds with the ROI.
- Click Refresh to acquire quantified values of the selected calcified region. Note the Min, Max, and Mean values according to the dataset table. Use the Mean values for quantification (Figure 7).
- Locate the volume calculation at the top of the Statistical Properties box. Use this volume for quantification (Figure 7).
- For CT datasets, the values are reported in HU. Calculate the volumetric calcium content (vHU) using the product of the mean ROI value (HU) and volume of ROI (mm3)12.
- For PET datasets, the values are reported in Becquerels (Bq), which correspond with decays/second. Convert to Bq/mm3 by dividing the mean ROI value (Bq) by the volume of the ROI (mm3), for tracer uptake concentration.
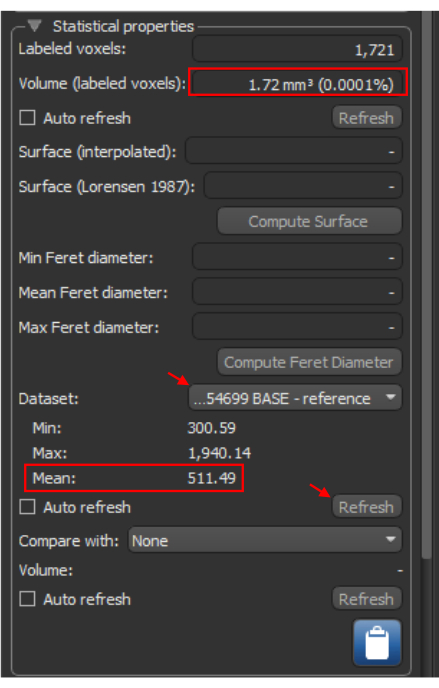
Figure 7: ROI quantification. The Statistical Properties tab for a selected ROI. The red arrows illustrate steps required to obtain statistical information for a dataset based on the ROI. The red boxes identify the volume and the mean Hounsfield unit value, essential for further analysis calculations. Abbreviation: ROI = region of interest. Please click here to view a larger version of this figure.
Results
Analysis methods
This section illustrates successful utilization through representative results. Here, we showcase the combined microPET/microCT image of a single mouse scanned at 15 and 18 months of age, after subjected to a Western diet (21% fat, 0.2% cholesterol) from 12 through 14 months of age. Following protocol sections 2-8 for calcification quantification, four independent researchers separately measured volumetric calcium content and 18F-NaF PET activity using the same represent...
Discussion
This novel protocol is an improved approach to the quantification of cardiovascular calcification. Due to the non-invasive nature of imaging, longitudinal microCT images may be acquired to follow the progression of cardiovascular calcification in small animals. Although microCT images alone can show the progression of calcium content, microPET images, when available, can provide additional levels of information, especially its enhanced detection of small calcium deposits due to tracer binding to surface area. For further...
Disclosures
The authors have no conflicts of interest to declare.
Acknowledgements
We thank all members of the UCLA Crump Preclinical Imaging Technology Center for their help with data acquisition and procession as well as equipment and infrastructure maintenance. We thank Jeffrey Collins for his help with cyclotron operation and 18F-NaF synthesis. We thank the UCLA Statistical Consulting Group for their help with statistical analysis. This work is supported by the NIH Cancer Center Support Grant (2 P30 CA016042-44 to MT) and National Institutes of Health, Heart, Lung, and Blood Institute (HL137647 and HL151391 to YT and LLD). The GNEXT PET/CT scanner was funded by NIH S10 Shared Instrumentation for Animal Research Grant (1S10OD026917-01A1 to Arion Chatziioannou).
Materials
| Name | Company | Catalog Number | Comments |
| 0.5 cc Sterile Insulin Syringes | Exel International | #26028 | Used for IV injection of 18F-NaF PET Tracer |
| 18F-NaF PET Tracer | CNSI Cyclotron | ||
| Biorender | Biorender | Used for figure 1 | |
| Female Apoe-/- mouse | Jackson Laboratories | #002052 | B6.129P2-Apoetm1Unc/J |
| GNEXT PET/CT | Sofie Biosciences, Dulles, Virginia | ||
| Isoflurane | Piramal Critical Care | Used as anesthesia for mouse imaging | |
| ORS Dragonfly | Comet Technologies Canada Inc. | ||
| SPSS Statistics | IBM | ||
| Western diet for mice | Envigo | #TD88139 | 21% fat, 0.2% cholesterol |
References
- Rennenberg, R. J. M. W., et al. Vascular calcifications as a marker of increased cardiovascular risk: A meta-analysis. Vasc Health Risk Man. 5, 185-197 (2009).
- Budoff, M. J., et al. Long-term prognosis associated with coronary calcification - observations from a registry of 25,253 patients. J Am Coll Cardiol. 49 (18), 1860-1870 (2007).
- Polonsky, T. S., et al. Coronary artery calcium score and risk classification for coronary heart disease prediction. JAMA. 303 (16), 1610-1616 (2010).
- Gepner, A. D., et al. Comparison of coronary artery calcium presence, carotid plaque presence, and carotid intima-media thickness for cardiovascular disease prediction in the multi-ethnic study of atherosclerosis. Circ Cardiovasc Imaging. 8 (1), e002262 (2015).
- Pillai, I. C. L., et al. Cardiac fibroblasts adopt osteogenic fates and can be targeted to attenuate pathological heart calcification. Cell Stem Cell. 20 (2), 218-232.e5 (2017).
- Mori, H., et al. Coronary artery calcification and its progression: What does it really mean. JACC Cardiovasc Imaging. 11 (1), 127-142 (2018).
- Mohan, J., Bhatti, K., Tawney, A., Zeltser, R. . StatPearls [Internet]. , (2023).
- Wang, Y., Osborne, M. T., Tung, B., Li, M., Li, Y. Imaging cardiovascular calcification. J Am Heart Assoc. 7 (13), e008564 (2018).
- Fletcher, A. J., et al. Quantifying microcalcification activity in the thoracic aorta. J Nucl Cardiol. 29 (3), 1372-1385 (2022).
- Derlin, T., et al. Feasibility of 18F-sodium fluoride PET/CT for imaging of atherosclerotic plaque. J Nucl Med. 51 (6), 862-865 (2010).
- Hsu, J. J., et al. Changes in microarchitecture of atherosclerotic calcification assessed by 18F-NaF PET and CT after a progressive exercise regimen in hyperlipidemic mice. J Nucl Cardiol. 28 (5), 2207-2214 (2021).
- Hsu, J. J., et al. Effects of teriparatide on morphology of aortic calcification in aged hyperlipidemic mice. Am J Physiol Heart Circ Physiol. 314 (6), H1203-H1213 (2018).
- Irkle, A., et al. Identifying active vascular microcalcification by 18F-sodium fluoride positron emission tomography. Nat Commun. 6, 7495 (2015).
- Syed, M. B. J., Doris, M., Dweck, M., Forsythe, R., Newby, D. E. Chapter 9 - Imaging vascular calcification: Where are we headed. Coronary Calcium: A Comprehensive Understanding of Its Biology, Use in Screening, and Interventional Management. , (2019).
- Joshi, N. V., et al. 18F-fluoride positron emission tomography for identification of ruptured and high-risk coronary atherosclerotic plaques: A prospective clinical trial. Lancet. 383 (9918), 705-713 (2014).
- Fiz, F., et al. 18F-NaF uptake by atherosclerotic plaque on PET/CT imaging: Inverse correlation between calcification density and mineral metabolic activity. J Nucl Med. 56 (7), 1019-1023 (2015).
- Kruithof, B. P., et al. An in vivo map of bone morphogenetic protein 2 post-transcriptional repression in the heart. Genesis. 49 (11), 841-850 (2011).
- Sheen, C. R., et al. Pathophysiological role of vascular smooth muscle alkaline phosphatase in medial artery calcification. J Bone Miner Res. 30 (5), 824-836 (2015).
- Tsai, M. T., Chen, Y. Y., Chang, W. J., Li, S. Y. Warfarin accelerated vascular calcification and worsened cardiac dysfunction in remnant kidney mice. J Chin Med Assoc. 81 (4), 324-330 (2018).
- Wait, J. M., et al. Detection of aortic arch calcification in apolipoprotein e-null mice using carbon nanotube-based micro-ct system. J Am Heart Assoc. 2 (1), e003358 (2013).
- White, D. J., et al. 19F MAS-NMR and solution chemical characterization of the reactions of fluoride with hydroxyapatite and powdered enamel. Acta Odontol Scand. 46 (6), 375-389 (1988).
- Czernin, J., Satyamurthy, N., Schiepers, C. Molecular mechanisms of bone 18F-NaF deposition. J Nucl Med. 51 (12), 1826-1829 (2010).
- Chen, N. X., O'neill, K. D., Dominguez, J. M., Moe, S. M. Regulation of reactive oxygen species in the pathogenesis of matrix vesicles induced calcification of recipient vascular smooth muscle cells. Vasc Med. 26 (6), 585-594 (2021).
- Klose, A. D., Paragas, N. Automated quantification of bioluminescence images. Nat Commun. 9 (1), 4262 (2018).
- Chen-Mayer, H. H., et al. Standardizing ct lung density measure across scanner manufacturers. Med Phys. 44 (3), 974-985 (2017).
- Coxson, H. O. Sources of variation in quantitative computed tomography of the lung. J Thorac Imaging. 28 (5), 272-279 (2013).
- Rogasch, J. M. M., et al. Influences on pet quantification and interpretation. Diagnostics (Basel). 12 (2), 451 (2022).
- Liljequist, D., Elfving, B., Skavberg Roaldsen, K. Intraclass correlation - a discussion and demonstration of basic features. PLoS One. 14 (7), e0219854 (2019).
- Koo, T. K., Li, M. Y. A guideline of selecting and reporting intraclass correlation coefficients for reliability research. J Chiropr Med. 15 (2), 155-163 (2016).
- Moss, A. J., et al. Molecular coronary plaque imaging using (18)f-fluoride. Circ Cardiovasc Imaging. 12 (18), e008574 (2019).
- Moss, A., et al. Coronary atherosclerotic plaque activity and future coronary events. JAMA Cardiol. 8 (8), 755-764 (2023).
- Badea, C., Hedlund, L. W., Johnson, G. A. Micro-ct with respiratory and cardiac gating. Med Phys. 31 (12), 3324-3329 (2004).
- Yang, Y., Rendig, S., Siegel, S., Newport, D. F., Cherry, S. R. Cardiac pet imaging in mice with simultaneous cardiac and respiratory gating. Phys Med Biol. 50 (13), 2979-2989 (2005).
- Liao, W., Deserno, T. M., Spitzer, K. Evaluation of free non-diagnostic dicom software tools. Proc Spie. 6919, (2008).
- Haak, D., Page, C. E., Deserno, T. M. A survey of dicom viewer software to integrate clinical research and medical imaging. J Digit Imaging. 29 (2), 206-215 (2016).
- Aiello, M., et al. How does dicom support big data management? Investigating its use in medical imaging community. Insights Imaging. 12 (1), 164 (2021).
- Kristanto, W., Van Ooijen, P. M., Groen, J. M., Vliegenthart, R., Oudkerk, M. Small calcified coronary atherosclerotic plaque simulation model: Minimal size and attenuation detectable by 64-MDCT and microCT. Int J Cardiovasc Imaging. 28 (4), 843-853 (2012).
- Dehmeshki, J., et al. Volumetric quantification of atherosclerotic plaque in ct considering partial volume effect. IEEE Trans Med Imaging. 26 (3), 273-282 (2007).
- Demer, L. L., Tintut, Y., Nguyen, K. L., Hsiai, T., Lee, J. T. Rigor and reproducibility in analysis of vascular calcification. Circ Res. 120 (8), 1240-1242 (2017).
- Alluri, K., et al. Scoring of coronary artery calcium scans: History, assumptions, current limitations, and future directions. Atherosclerosis. 239 (1), 109-117 (2015).
- Zhang, L., et al. Advances in CT techniques in vascular calcification. Front Cardiovasc Med. 8, 716822 (2021).
- Achenbach, S., Raggi, P. Imaging of coronary atherosclerosis by computed tomography. Eur Heart J. 31 (12), 1442-1448 (2010).
- Agatston, A. S., et al. Quantification of coronary artery calcium using ultrafast computed tomography. J Am Coll Cardiol. 15 (4), 827-832 (1990).
Reprints and Permissions
Request permission to reuse the text or figures of this JoVE article
Request PermissionThis article has been published
Video Coming Soon
Copyright © 2025 MyJoVE Corporation. All rights reserved