A subscription to JoVE is required to view this content. Sign in or start your free trial.
Methods Article
RGBradford: Protein Quantitation with a Smartphone Camera
In This Article
Summary
This paper provides a protocol for protein quantification using the Bradford assay and a smartphone as an analytical device. Protein levels in samples can be quantified using color data extracted from a picture of a microplate taken with a smartphone.
Abstract
Protein quantitation is an essential procedure in life sciences research. Amongst several other methods, the Bradford assay is one of the most used. Because of its widespread, the limitations and advantages of the Bradford assay have been exhaustively reported, including several modifications of the original method to improve its performance. One of the alterations of the original method is the use of a smartphone camera as an analytical instrument. Taking advantage of the three forms of the Coomassie Brilliant Blue dye that exist in the conditions of the Bradford assay, this paper describes how to accurately quantify protein in samples using color data extracted from a single picture of a microplate. After performing the assay in a microplate, a picture is taken using a smartphone camera, and RGB color data is extracted from the picture using a free and open-source image analysis software application. Then, the ratio of blue to green intensity (in the RGB scale) of samples with unknown concentrations of protein is used to calculate the protein content based on a standard curve. No significant difference is observed between values calculated using RGB color data and those calculated using conventional absorbance data.
Introduction
Regardless of the downstream use (e.g., ELISA, enzyme kinetics, western blotting, protein purification, and mass spectrometry), protein quantification is crucial for accurate analysis in life sciences laboratories. In addition to their use as secondary readouts (i.e., to calculate relative levels of analytes per mass of protein), protein levels in a sample can also be the desired output itself. For example, one can be interested in protein levels in food resources1 or in urine2. There are many methods available to measure protein concentration in samples3, including direct UV absorbance readings4, protein-copper chelation5,6, protein-dye binding colorimetric assays7, and protein-dye binding fluorescent assays8. The relevance of protein quantitation is evidenced by the presence of two papers describing protein measurement methods5,7 in the top-3 of the most cited literature9,10. Despite the fact that many authors neglect their actual citation by citing non-primary references or not citing anything at all, the original papers describing the Lowry protein assay and the Bradford protein assay amount >200,000 citations each10.
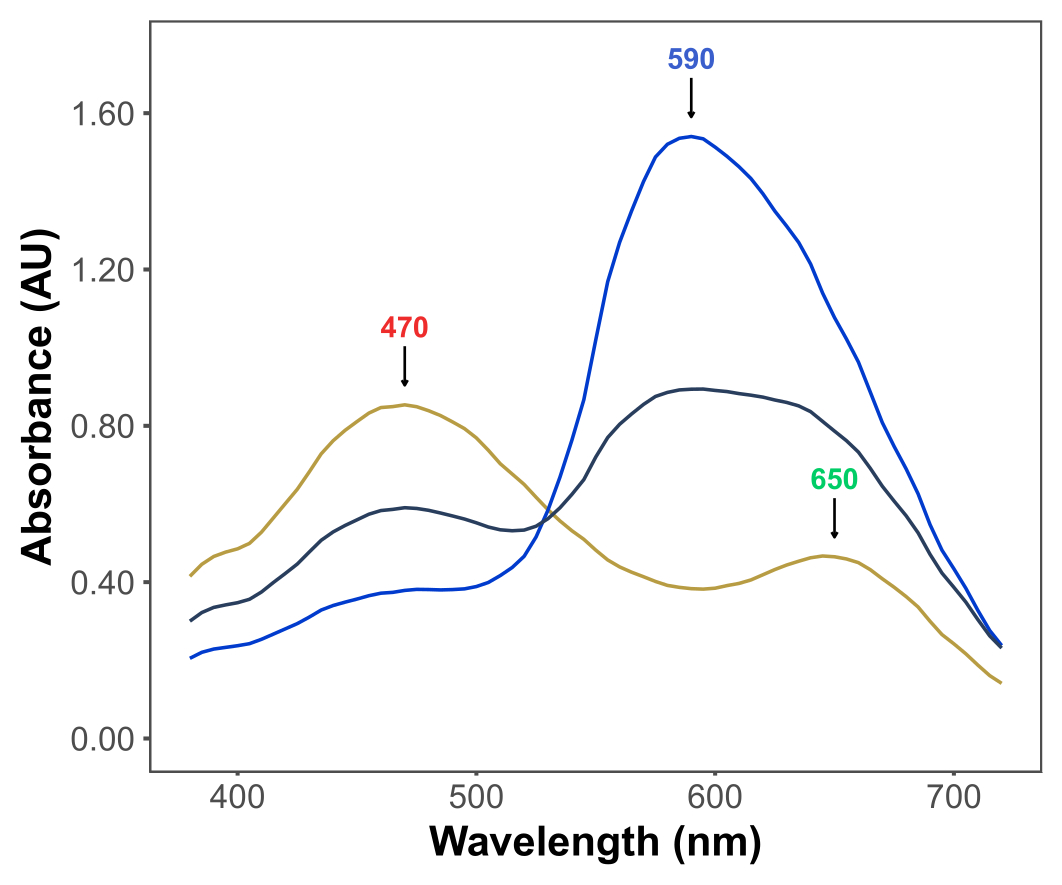
The popularity of the Bradford assay stems from its affordability, simplicity, speed, and sensitivity. The assay is based on the interaction between proteins and the dye Coomassie Brilliant Blue G under acidic conditions. Under the conditions of the assay (i.e., low pH), the dye exists in three forms: a red cationic form with λmax at 470 nm; a green neutral form with λmax at 650 nm; and a blue anionic form with λmax at 590 nm11,12 (Figure 1). The cationic form predominates in the absence of proteins. As proteins interact with the dye, they stabilize the blue anionic form, causing a noticeable change in the color of the solution, from brownish to blue. Usually, the change in the concentration of the blue form of the dye is quantified spectrophotometrically, whose absorbance at 590-595 nm is proportional to the quantity of protein in the assay.

Figure 1: Coomassie brilliant blue G absorption spectra under the conditions of the Bradford assay. The three main peaks are marked with arrows indicating the λmax of the red (470 nm), green (650 nm), and blue (590 nm) forms of the dye. Spectra were recorded in the absence of protein (yellow line) and in the presence of 3 µg (gray line) and 10 µg (blue line) of bovine serum albumin. Please click here to view a larger version of this figure.
The widespread use of the Bradford assay has led to the identification of several limitations (e.g., variable responses to different proteins11, and interference by lipids13 and detergents7) and the development of modifications to improve its performance (e.g., the addition of detergents14,15, alkalinization14,16 and use of the ratio of absorbances17). In addition to modifications in the assay itself, the use of alternative devices, such as smartphones or cameras, to capture analytical signals have also been described18,19,20. Indeed, the development of methods that make use of smartphones as portable chemical analyzers has been an active area of research. The motivation for the use of smartphones stems from the affordability, portability, ease of use, and widespread availability of these devices.
This paper provides a protocol for protein quantification using the RGBradford assay20, which uses a smartphone as an analytical device. In contrast to the original RGBradford publication20, here, a procedure that streamlines the color extraction process has been introduced. It involves the utilization of a freely available software application to extract color information from each well of a microplate picture automatically, saving significant time and effort. This is an alternative to the previous method of manually acquiring color data from each well one by one using a graphics editor software application20. Ultimately, protein levels in samples can be quantified using color data extracted from a picture of a microplate taken with a smartphone.
Protocol
1. Preparation of the Bradford protein assay reagent
- Dissolve 100 mg of Coomassie Brilliant Blue G in 50 mL 95% (w/v) ethanol. Mix until Coomassie Brilliant Blue G is completely dissolved.
CAUTION: Ethanol is flammable and causes eye irritation. Avoid flames and use goggles. - To the previous solution, add 100 mL of 85% (w/v) phosphoric acid carefully.
CAUTION: Phosphoric acid is corrosive to metals and causes skin corrosion, serious eye damage, and acute oral toxicity. Wear gloves and goggles. - Add the solution containing Coomassie Brilliant Blue G, ethanol, and phosphoric acid slowly to 600 mL of deionized water.
- Dilute the solution to a final volume of 1,000 mL. Scale up or down according to the number of samples to be analyzed. As described in the original method7, final concentrations in the working Bradford reagent should be 0.01% (w/v) Coomassie Brilliant Blue G, 4.7% (w/v) ethanol, and 8.5% (w/v) phosphoric acid.
- Remove any insoluble material filtering through filter paper (Whatman #1 paper or equivalent).
- The reagent is stable for several weeks when stored at room temperature (RT) and protected from light. Filter as necessary since precipitates may form over time.
NOTE: Alternatively, ready to dilute and use Bradford reagents are commercially available. Follow the manufacturer's instructions for preparing the reagent and proceed to the next step.
2. Preparation of protein standard solutions
- Prepare a stock solution (refer to step 2.4) of an isolated protein to be used as standard. An affordable and commonly used protein is bovine serum albumin (BSA). Other options are ovalbumin and bovine gamma globulin.
- If the molar absorptivity of the protein used as standard is known, check the concentration of the stock solution in a spectrophotometer.
- For BSA, a commonly used formula is BSA (mg/mL) = (A280/6.6) × 10, where A280 is the absorbance at 280 nm with a path length of 1 cm read against an appropriate blank (i.e., ε2801% = 6.6)7. For example, 0.8 mg/mL BSA has an absorbance of 0.528 at 280 nm.
- To generate the standard curve, prepare several dilutions of BSA within 0.025 mg/mL and 1.0 mg/mL. These will result in 0.25-10 µg of BSA per well after adding a sample volume of 10 µL per well.
NOTE: Protein standard solutions should be prepared in a medium with the same composition (final concentration) of the medium used to prepare samples.
3. Assay
- Dilute the samples to achieve a protein concentration within the standard curve range of 0.025-1.0 mg/mL. Have several (at least 3) sample dilutions within the range.
NOTE: Samples can be diluted with phosphate-buffered saline (PBS) or any other medium/buffer composition compatible with the Bradford reagent. The final concentration of medium components should not differ between standard and samples. - Add 10 µL of each protein standard solution to three wells (i.e., in triplicate) of a 96-well microplate. For the 0 (zero) protein point, add 10 µL of the buffer/medium used to prepare the standard solutions and sample dilutions.
- To another set of wells, add 10 µL of each sample dilution to three wells (i.e., in triplicate) of the same 96-well microplate. One approach is to add different volumes of a sample and complete with a medium of up to 10 µL per well (e.g., 0.5 µL, 1 µL, 2 µL, 4 µL, and 8 µL of the sample plus 9.5 µL, 9 µL, 8 µL, 6 µL, and 2 µL of medium).
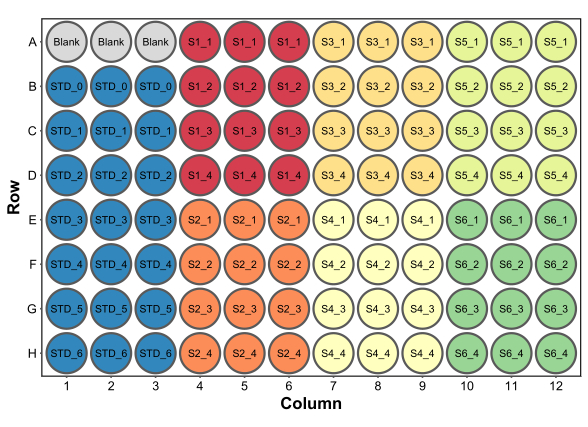
- Add 250 µL of Bradford protein assay reagent to all wells. A typical microplate setup is shown in Figure 2. In this example, a set of blank wells containing 260 µL (the final volume per well) water was included to serve as blank in a microplate reader (step 4.5). This is required only if absorbance data will also be collected.
NOTE: Prepare a standard curve in the same microplate of samples each time the assay is performed. In other words, if the number of samples requires another plate, prepare another standard curve in the second plate, and so on. - Record results (section 4) within 5-15 min.

Figure 2: A typical plate layout for the Bradford protein assay. Blank refers to three wells containing 260 µL of water to be used as blank in a microplate reader. STD refers to protein standards. S1-S6 are six different samples. SX_1-SX_4 are four different sample dilutions for each sample. Please click here to view a larger version of this figure.
4. Recording results
- In a well-illuminated room, hold the microplate parallel to the bench against a uniform white background (e.g., a paper sheet) with one hand. Ensure accurate alignment by placing a bubble level on the plate.
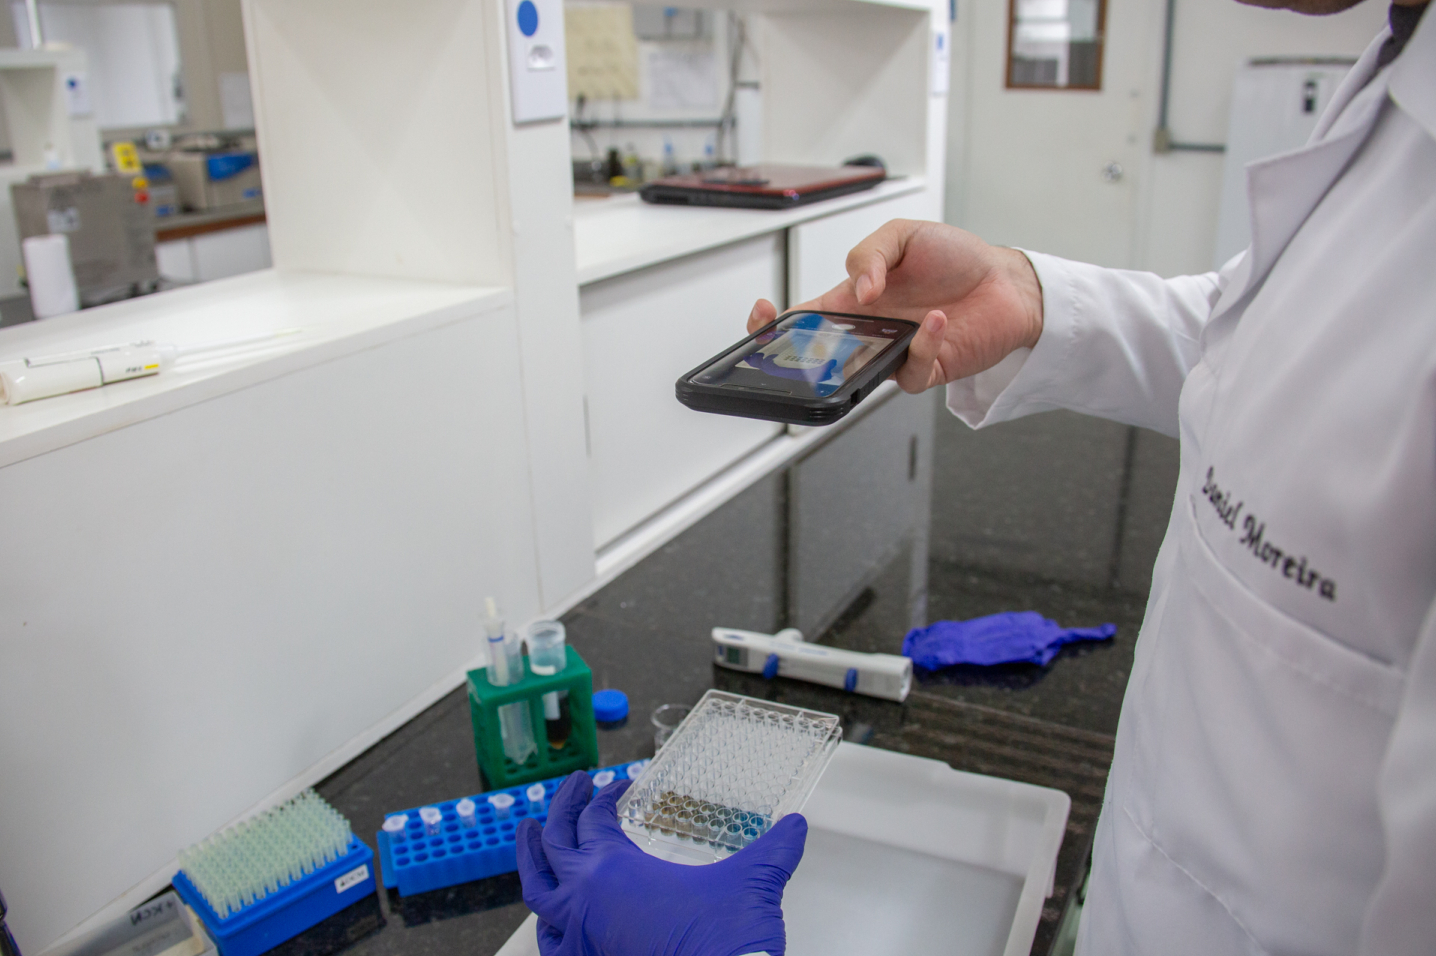
- With the other hand, hold the smartphone parallelly (some camera applications usefully indicate the inclination of the device) to the bench and the microplate and take one or several pictures of the whole microplate (Figure 3). In iOS devices, turn on the camera level indicator in the camera settings by enabling the Grid option. In Android devices, turn on the camera level indicator in the camera settings by enabling Framing Hints.
- No special lighting apparatus is required, but take care to avoid shadows and reflections. For example, avoid shading the plate or the background with the smartphone and avoid shading the background with the microplate. Small reflections in the edges of the well area are not a problem; color data can be extracted from a very small area in the center of each well.
- Briefly check the picture for background uniformity, shadows, and reflections. Also, take a look at the angle of the wells; the center of each well should be directly visible (i.e., not behind well walls).
- If the comparison between microplate absorbance readings and picture color data is desired, read the microplate at 590 nm and 450 nm in a microplate reader21.

Figure 3: Capturing the results of the Bradford protein assay. In a well-illuminated room, the microplate is positioned parallelly to the bench against a uniform background with one hand. With the other hand, the smartphone is hold parallelly to the bench and the microplate. Please click here to view a larger version of this figure.
5. Extracting color data-Automatically
- Download ImageJ and ReadPlate22, an ImageJ plugin is available at https://imagej.nih.gov/ij/plugins/readplate/index.html (this is a .txt file).
- Open ImageJ, click on Plugins > Install and select the file downloaded in step 6.1.
- Set the measurement parameters by clicking on Analyze > Set Measurements and check the following options: Area; Standard deviation; Min & max gray value; Mean gray value; Modal gray value. On the bottom of the window, set Redirect to: None and Decimal places (0-9): 3.
- Go to File > Open and select the picture of the microplate taken in step 4.
- Go to Plugins > ReadPlate. Read the instructions and then click OK.
- Select the number of wells: 96.
- Using the Rectangular selection tool automatically loaded by the plugin, make a rectangle beginning in the center of the A1 well and ending in the center of the H12 well. Then, click OK.
- Select the Blue channel and click OK.
- Confirm the default parameters by clicking on OK.
- Check if the software delineated an area inside each well and if the selected areas are not covering areas with abnormal shadows or reflection. Click OK.
- Save the results and repeat steps 5.8-5.10 for the green channel.
- Calculate the blue-to-green ratio using the mode for each color.
NOTE: The calculation can be done manually or using the software of the reader preferences, such as R, Microsoft Excel, or GraphPad Prism.
6. Extracting color data-Manually
- Download Inkscape, a free and open-source graphics editor.
NOTE: Any software with the color picker tool (usually depicted as an eye dropper) can be used to identify the color and extract RGB data. - Open Inkscape, go to File > Open. Select the picture of the microplate taken in Step 4.
- Pick the Select and Transform Objects (S) tool, which is depicted as an arrow on the top-left side, and click on the picture. A dashed line border will indicate the selection.
- Select the Pick Colors from Image (D) tool, which is depicted as an eye dropper on the left side.
- Click in the center of a well. The color on the bottom panel ("Fill:") will change accordingly. Click on the color and a Fill and Stroke tab will pop up on the right side.
- Change the Flat Color dropdown menu to RGB. Record the values shown for the blue and green channels for each well.
- Calculate the blue-to-green ratio using the recorded values.
NOTE: The calculation can be done manually or using the software of the reader preferences, such as R, Microsoft Excel, or GraphPad Prism.
7. Building standard curves and extrapolating unknowns
- Plot the average green-to-blue intensity ratio as a function of protein standard concentration.
NOTE: Plot the data manually or using the software of the reader preferences, such as R, Microsoft Excel, or GraphPad Prism. - Calculate the average green-to-blue intensity ratio for each sample and dilution.
- Check if the signal obtained for the sample lies within the linear range of the protein standard.
- Ignore any value below or above the minimum or maximum values of the standard curve.
- Use the linear equation describing the standard curve to extrapolate the amount of protein in the sample. Multiply the calculated values by the dilution factor accordingly.
Results
Figure 4 is a picture of a microplate from which color data was extracted, and absorbance at 450 nm and 590 nm was recorded. The RGB color data reported here as representative were obtained automatically as described in section 5. A typical pattern of color data is an increase in the blue values and a decrease in the red and green values (Figure 5). Note that despite the evident reflection in all wells and a not perfectly aligned microplate (
Discussion
This paper describes RGBradford, a method that uses a smartphone camera to record data from a Bradford protein assay, extract color data, and accurately quantify protein levels in biological samples as originally described recently20. One difference from the original RGBradford method is that here a procedure for obtaining color data automatically with an ImageJ plugin22 was used. The main novelty of the RGBradford method is the use of RGB data as analytical signals; thus, ...
Disclosures
The author has no conflicts of interest to declare.
Acknowledgements
This work was funded by the National Council for Scientific and Technological Development (CNPq, Brazil) [grant numbers 428048/2018-8 and 402556/2022-4] and the University of Brasilia (Brazil). The author thanks Dr. Duarte Nuno Carvalho and Dr. Evelyn Santos (i3s, Porto, Portugal) for providing access to their smartphones used in this research.
Materials
| Name | Company | Catalog Number | Comments |
| 96-well flat-bottom polystyrene microtiter plates | Jet Biofil, Guangzhou, China | TCP011096 | Any flat-bottom microplate compativle with optical reading will suffice. |
| Bovine serum albumin | Sigma-Aldrich, St. Louis, MO | A2153 | |
| Coomassie Brilliant Blue G | Sigma-Aldrich, St. Louis, MO | B0770 | |
| Ethyl alcohol | |||
| iPhone 11 | Apple | MWM02BR/A | Can be substituted with other smartphone equiped with a camera |
| iPhone 14 Pro | Apple | N/A | |
| Phosphoric acid | Sigma-Aldrich, St. Louis, MO | 695017 | |
| Redmi Note 9 Pro | XIAOMI | N/A | |
| S22 Ultra | Samsung | N/A | |
| SpectraMax 384 Plus. Microplate reader. | Molecular Devices, San Jose, CA | PLUS 384 | Any microplate reader capable of reading at 450 nm and 590 nm will work. This is optional. The method was actually created to dismiss the need of a microplate reader. |
References
- Zaguri, M., Kandel, S., Rinehart, S. A., Torsekar, V. R., Hawlena, D. Protein quantification in ecological studies: A literature review and empirical comparisons of standard methodologies. Methods in Ecology and Evolution. 12 (7), 1240-1251 (2021).
- Koga, T., et al. Mild electrical stimulation and heat shock ameliorates progressive proteinuria and renal inflammation in mouse model of Alport syndrome. PLoS One. 7 (8), e43852 (2012).
- Peterson, G. L. Determination of total protein. Methods in Enzymology. 91, 95-119 (1983).
- Goldfarb, A. R., Saidel, L. J., Mosovich, E. The ultraviolet absorption spectra of proteins. The Journal of Biological Chemistry. 193 (1), 397-404 (1951).
- Lowry, O. H., Rosebrough, N. J., Farr, A. L., Randall, R. J. Protein measurement with the Folin phenol reagent. The Journal of Biological Chemistry. 193 (1), 265-275 (1951).
- Smith, P. K., et al. Measurement of protein using bicinchoninic acid. Analytical Biochemistry. 150 (1), 76-85 (1985).
- Bradford, M. M. A rapid and sensitive method for the quantitation of microgram quantities of protein utilizing the principle of protein-dye binding. Analytical Biochemistry. 72 (1-2), 248-254 (1976).
- Datki, Z., et al. Application of BisANS fluorescent dye for developing a novel protein assay. PLoS One. 14 (4), e0215863 (2019).
- Van Noorden, R., Maher, B., Nuzzo, R. The top 100 papers. Nature. 514 (7524), 550-553 (2014).
- . Scopus Available from: https://www.scopus.com/ (2022)
- Compton, S. J., Jones, C. G. Mechanism of dye response and interference in the Bradford protein assay. Analytical Biochemistry. 151 (2), 369-374 (1985).
- Chial, H. J., Thompson, H. B., Splittgerber, A. G. A spectral study of the charge forms of Coomassie Blue G. Analytical Biochemistry. 209 (2), 258-266 (1993).
- Pande, S. V., Murthy, M. S. R. A modified micro-Bradford procedure for elimination of interference from sodium dodecyl sulfate, other detergents, and lipids. Analytical Biochemistry. 220 (2), 424-426 (1994).
- Gogstad, G. O., Krutnes, M. -. B. Measurement of protein in cell suspensions using the Commassie brilliant blue dye-binding assay. Analytical Biochemistry. 126 (2), 355-359 (1982).
- Friedenauer, S., Berlet, H. H. Sensitivity and variability of the Bradford protein assay in the presence of detergents. Analytical Biochemistry. 178 (2), 263-268 (1989).
- Stoscheck, C. M. Increased uniformity in the response of the Coomassie blue G protein assay to different proteins. Analytical Biochemistry. 184 (1), 111-116 (1990).
- Zor, T., Selinger, Z. Linearization of the Bradford protein assay increases its sensitivity: Theoretical and experimental studies. Analytical Biochemistry. 236 (2), 302-308 (1996).
- Gee, C. T., Kehoe, E., Pomerantz, W. C. K., Penn, R. L. Quantifying protein concentrations using smartphone colorimetry: A new method for an established test. Journal of Chemical Education. 94 (7), 941-945 (2017).
- de Camargo, C., Vicentini, M., Gobbi, A., Martinez, D., Lima, R. Smartphone for point-of-care quantification of protein by Bradford assay. Journal of the Brazilian Chemical Society. 28 (4), 689-693 (2016).
- Moreira, D. C. RGBradford: Accurate measurement of protein concentration using a smartphone camera and the blue to green intensity ratio. Analytical Biochemistry. 655, 114839 (2022).
- Ernst, O., Zor, T. Linearization of the Bradford Protein Assay. Journal of Visualized Experiments. (38), 1918 (2010).
- Angelani, C. R., et al. A metabolic control analysis approach to introduce the study of systems in biochemistry: the glycolytic pathway in the red blood cell: Metabolic control analysis and the glycolytic pathway. Biochemistry and Molecular Biology Education. 46 (5), 502-515 (2018).
Reprints and Permissions
Request permission to reuse the text or figures of this JoVE article
Request PermissionThis article has been published
Video Coming Soon
Copyright © 2025 MyJoVE Corporation. All rights reserved